You can have excellent Health, Safety, and Environment (HSE) data and still give a terrible executive presentation.
A spreadsheet full of incident rates, audit findings, corrective actions, and inspection results may be useful to the HSE team. But executives need something different: What is the problem? What does it mean for the business? What should we do about it? And what will it take?
That is why presenting Health and Safety Management System (HSMS) findings well matters. Management leadership includes providing the resources needed to operate an effective safety and health program, while performance evaluation helps organizations determine whether their intended results are being achieved. OSHA’s guidance on evaluating safety and health programs emphasizes using performance information to assess program effectiveness.
The good news is that your presentation does not need 30 slides and enough charts to qualify as modern art.
It needs a clear story.
Use this structure:
Current state → Key findings → Business risk → Recommendation → Investment value → Roadmap → Decision
1. Start With the Executive Message
Before opening PowerPoint, decide what you want executives to understand or approve.
Are you asking for:
- An HSMS investment?
- Additional resources?
- Action on a major risk?
- Process improvements?
- New software?
- Approval for an improvement roadmap?
Then build the presentation around that decision.
Example
Instead of opening with:
“We conducted 147 inspections this year.”
Start with:
“Recurring findings and delayed corrective actions are leaving known risks unresolved. We recommend centralizing corrective-action management to improve accountability and management visibility.”
Now they know why they should care.
2. Summarize the Current State
Give executives a quick baseline using only the metrics relevant to your point.
A good HSMS presentation should generally use a combination of lagging indicators, such as incidents and injuries, and leading indicators, such as hazard reports, inspections, training completion, response times, and timely corrective-action closure. OSHA specifically recommends using both because they provide different information about safety performance.
This also aligns with ISO 45004’s guidance on OH&S performance evaluation, which covers monitoring, measurement, analysis, and evaluation of occupational health and safety performance.
For example:
| Metric | Current | Previous |
| Corrective actions closed on time | 72% | 84% |
| Inspection completion | 91% | 89% |
| Average hazard response time | 4.2 days | 2.8 days |
| Recordable incidents | 4 | 3 |
Don’t simply show the numbers. Add the takeaway:
“Inspection completion has remained stable, but corrective-action performance and hazard-response time have deteriorated.”
That sentence is what executives actually need.
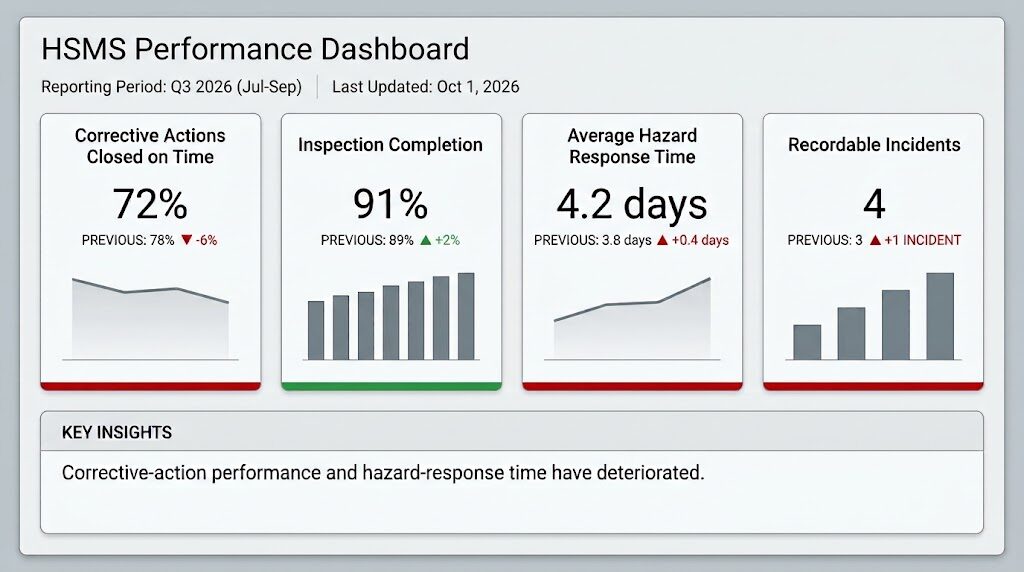
Use a 4–5 KPI dashboard like the example above. Keep it simple. The chart should make the message easier to understand, not give everyone a small headache.
3. Turn Findings Into Business Risk
An HSE finding becomes more persuasive when you explain what it could mean for the organization.
Use this simple formula:
Finding → Risk → Business impact
Example
Finding: 28% of corrective actions are overdue.
Risk: Identified hazards or system deficiencies may remain unresolved.
Business impact: Continued exposure to incidents, repeat findings, compliance issues, and operational disruption.
Another example:
Finding: Inspection records are maintained across multiple spreadsheets.
Risk: Information is harder to consolidate and monitor.
Business impact: More manual reporting, slower management visibility, and a greater chance of missing overdue actions.
This is the point where you stop presenting HSE information as an isolated department issue and start showing its relevance to the wider business.
4. Show Where the Risk Is Concentrated
Executives do not need every finding. They need to know which findings deserve attention first.
Prioritize based on factors such as:
- Severity
- Likelihood
- Recurrence
- Regulatory significance
- Operational impact
- Time left unresolved
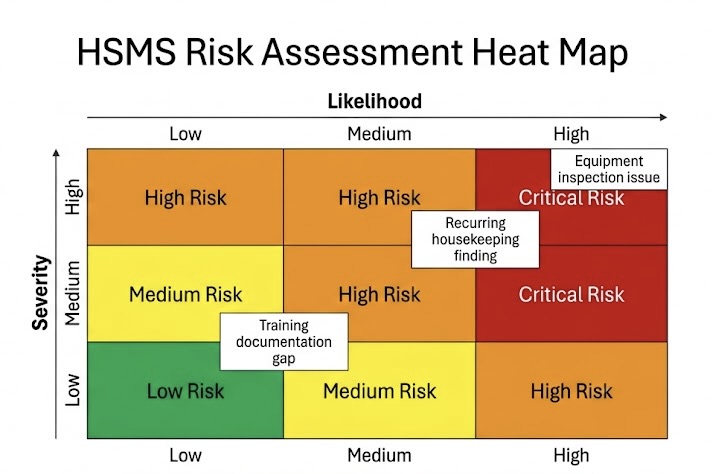
Use a risk heat map to show where the highest-priority issues sit.
For example:
Then add one sentence:
“Three recurring findings account for the majority of our high-priority risk exposure and should be addressed first.”
The visual gives executives the big picture. Your sentence gives them the conclusion.
5. Make the Recommendation Specific
Avoid recommendations like:
“Improve safety management.”
Technically true. Practically useless.
Instead, say exactly what should change.
Example
Problem: Corrective actions are tracked through spreadsheets and email.
Recommendation: Centralize corrective-action assignment, ownership, deadlines, evidence, and escalation.
Expected result: Better visibility and more timely closure.
KPI: Percentage of corrective actions closed by their target date.
This structure also makes it easier to connect an HSMS investment to an actual business problem.
6. Show the Investment Value
If you are asking for an investment, don’t jump straight to the price.
Show:
Investment → Problem addressed → Expected value → Measurement
For example:
Investment: HSMS software and implementation
Problem addressed: Fragmented records and manual corrective-action tracking
Expected value: Less administrative work, better follow-up, improved management visibility
Measurement: Reporting hours, closure rate, average closure time, overdue actions
Where reliable financial data exists, calculate the potential return.
ROI = (Financial Benefit − Investment Cost) ÷ Investment Cost × 100
For example, if an investment costs $50,000 and produces $80,000 in measurable annual benefits:
ROI = ($80,000 − $50,000) ÷ $50,000 × 100 = 60%
But don’t force every safety benefit into a dollar figure. Risk reduction, compliance, better visibility, and improved control may be strategically important even when their exact financial value cannot be predicted.
The value of an HSMS also goes beyond the financial return of a single investment. A structured system can help organizations manage risks consistently, strengthen accountability, and improve safety performance over time. This is why a strong health and safety management system should be viewed as part of the organization’s overall approach to managing risk, rather than simply another operational expense.
That broader value gives executives a clearer picture of what the investment is intended to achieve and how its impact can be measured.
7. Show the Future State
Don’t just tell executives that the proposed change will improve the process. Show them.
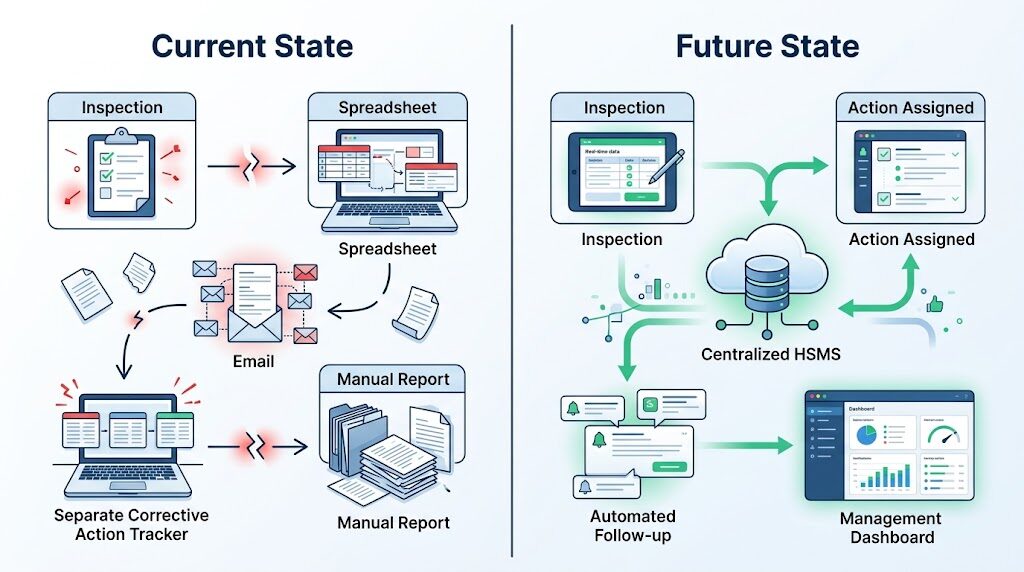
Use a simple before-and-after workflow.
Current:
Inspection → Spreadsheet → Email → Separate corrective-action tracker → Manual report
Future:
Inspection → Centralized HSMS → Action assigned → Automated follow-up → Management dashboard
Now the investment has a visible purpose.
You’re not saying, “We need software because software is nice.”
You’re saying, “This is the process problem, and this is how the proposed system changes it.”
For organizations considering this type of digital transformation, HSE management software can help connect activities such as risk management, corrective actions, inspections, training, and reporting within a centralized system.
8. Give Them a Roadmap
An investment feels much easier to evaluate when executives can see how it will be implemented.
Keep the roadmap simple:
Phase 1: StabilizeAddress critical risks, overdue actions, ownership, and reporting.
Phase 2: SystematizeCentralize information, standardize workflows, automate follow-up, and establish dashboards.
Phase 3: ImproveAnalyze trends, identify recurring issues, review KPIs, and continuously improve controls.
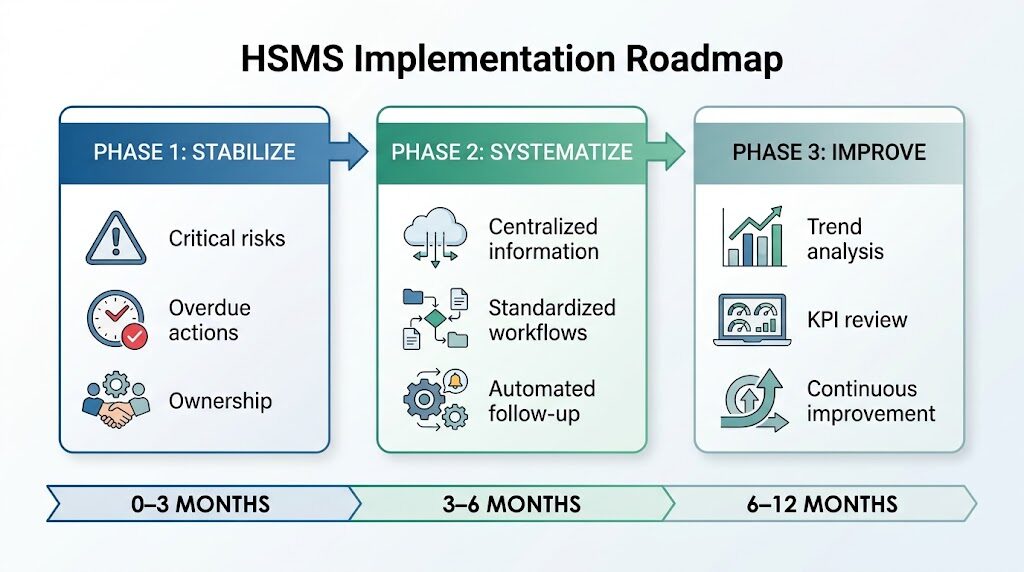
Use a simple three-stage timeline:
0–3 months → Stabilize3–6 months → Systematize6–12 months → Improve
Add only the most important actions under each stage.
9. End With the Decision
Your final slide should not be another data dump.
It should tell executives exactly what you need.
Example
Decision requested: Approve Phase 1 of the HSMS improvement program.
Investment: $50,000
Timeline: 3 months
Primary objective: Improve corrective-action visibility and follow-up
Success measures: On-time closure rate, average closure time, reporting time
Then stop.
No dramatic final chart. No 14-bullet summary. You’ve already made the case.
A Simple 8-Slide HSMS Presentation
If you need a quick structure, use:
- Executive Summary: Problem, risk, recommendation, decision
- Current State: 3 to 5 relevant KPIs
- Key Findings: Major trends and recurring issues
- Risk: Business and HSE implications
- Recommendations: What should change and why
- Investment Value: Cost, measurable benefits, risk reduction
- Roadmap: Implementation phases and timeline
- Decision Required: What management needs to approve
Turn HSMS Findings Into Executive Action
The purpose of presenting HSMS findings is not to prove that the HSE team has collected a lot of data.
It is to make the risk visible, the action clear, and the value of improvement understandable.
A strong presentation takes:
“28% of corrective actions are overdue.”
and turns it into:
“Known risks are remaining unresolved. Here is why that matters, here is what we recommend, here is what it will cost, and here is how we will measure whether it worked.”
That is the difference between an HSE report and an executive business case.
When an HSMS investment is involved, management needs to see not just the cost of improving the system, but the risk being addressed, the operational value created, and the measurable outcomes expected from the investment.
For organizations that need to connect HSE activities with broader management-system processes, QISS QMS provides a centralized platform for managing areas such as risk, audits, corrective actions, HSE activities, training, and related quality processes.
To see how QISS QMS can support your Health and Safety Management processes, request a free demo.